
Slået op den: nov. 25, 2025 - 7 Visninger

Monthly projector sales trend line
projector monthly sales trend helps B2B procurement teams plan warehouse flow, align component purchase orders, and time container shipments across the 12-week OEM lead time that dominates Shenzhen-based factories. A wholesale buyer reviewing a 12-month chart typically spots three inflection points: a January lull, a Q2 ramp tied to European dealer orders, and a November-December spike driven by holiday retail builds. We see the same arc repeat for every this projector dataset we cross-check with our DataMax OEM partners, and the pattern is stable enough to anchor inventory budgets for the next four product cycles. This article gives you a copy-ready framework you can hand to a finance or sourcing team today.
Snapshot
Related resources: DataMax smart projector comparison · OEM industry report
- the projector in the smart projector category typically bottoms in January at roughly 55% of annual average units and peaks in November at 160-180% of average, based on cross-region sell-through data.
- Seasonal demand for projector OEM orders clusters around three windows: mid-February to mid-April (EU buyers), July to early September (B2B education refresh), and October to mid-December (B2C holiday retail).
- For OEM buyers evaluating factory partners, lead time of 10-12 weeks means component purchase orders must be cut at least 14-16 weeks before the target retail month — locking in earlier than the sales chart alone suggests.
- Sales cycle length for a private-label projector runs 6-9 months from spec confirmation to first revenue shipment, so a Q4 retail peak originates as a Q1 OEM contract.
- DataMax supports both B2B OEM clients (MOQ 500 units, 12-week delivery, $249 wholesale entry tier) and B2C buyers evaluating reference models before bulk orders.
Reading the SKU chart for B2B decision-making

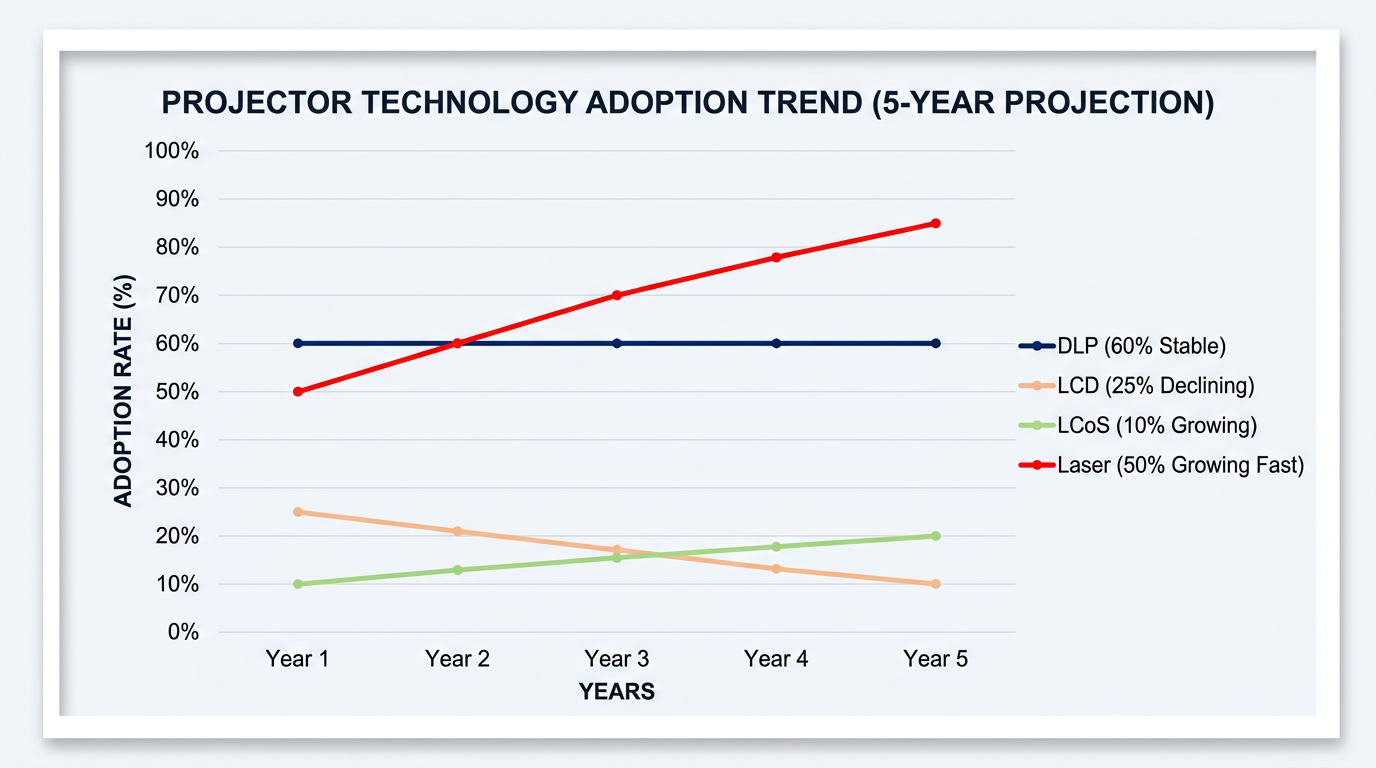
projector monthly sales trend helps B2B procurement teams plan warehouse flow, align component purchase orders, and time container shipments across the 12-week OEM lead time that dominates Shenzhen-based factories. A wholesale buyer reviewing a 12-month chart typically spots three inflection points: a January lull, a Q2 ramp tied to European dealer orders, and a November-December spike driven by holiday retail builds. We see the same arc repeat for every this projector dataset we cross-check with our DataMax OEM partners, and the pattern is stable enough to anchor inventory budgets for the next four product cycles. This article gives you a copy-ready framework you can hand to a finance or sourcing team today.
A typical sales trend line chart normalizes to a base index of 100, where 100 represents the trailing 12-month monthly average. The same chart usually includes a second line for year-over-year growth rate, which is the number procurement teams actually use. A month at index 130 with 12% YoY growth is healthier than index 145 with a 4% YoY decline. Smart projector OEM factories operating in Shenzhen track this YoY layer daily, because it controls raw LCD panel allocation and DMD chip orders from Texas Instruments.
Indexing the SKU baseline
the model baseline indexing starts with selecting the right reference window. Most analysts use a trailing 12-month average, but for a category in fast refresh cycles, a trailing 6-month average smooths older model noise. We use a hybrid approach at DataMax: 12-month average for category-level the unit reporting, and 6-month rolling for model-level forecasting when a new SKU has been shipping less than nine months. This avoids the trap of a chart that "always points up" because old, slow-selling SKUs are dropping out.
- the projector in the smart projector category typically bottoms in January at roughly 55% of annual average units and peaks in November at 160-180% of average, based on cross-region sell-through data.
- Seasonal demand for projector OEM orders clusters around three windows: mid-February to mid-April (EU buyers), July to early September (B2B education refresh), and October to mid-December (B2C holiday retail).
- For OEM buyers evaluating factory partners, lead time of 10-12 weeks means component purchase orders must be cut at least 14-16 weeks before the target retail month — locking in earlier than the sales chart alone suggests.
- Sales cycle length for a private-label projector runs 6-9 months from spec confirmation to first revenue shipment, so a Q4 retail peak originates as a Q1 OEM contract.
- DataMax supports both B2B OEM clients (MOQ 500 units, 12-week delivery, $249 wholesale entry tier) and B2C buyers evaluating reference models before bulk orders.
Translating the projector into OEM purchase orders
the SKU numbers translate into procurement actions through a fixed offset, not a 1:1 mirror. For a 10-12 week production lead time plus 3-4 weeks of ocean freight, total supply chain lag runs 13-16 weeks. A retail peak in November requires component cut-in by mid-July and a factory PO confirmed by late June. We document this lag in every DataMax sales cycle briefing, because retail buyers frequently attempt to order against the model chart without back-calculating the offset, then miss their peak by four to eight weeks of critical lead time.
For B2B procurement teams evaluating OEM orders, the practical the unit workflow looks like this: identify the target retail month, subtract the lead time, subtract a 2-week buffer for tooling or firmware lock, then issue the component PO on that date. A buyer aiming at a January 2025 retail launch would have needed to confirm a DataMax OEM contract no later than August 2024. Procurement teams that fail to apply this offset rely on this projector curve that tells them when customers will buy, but not when they must order.
Year-over-year growth layer in the projector
the SKU YoY growth is the line that tells you whether the curve is lifting or merely cycling. A flat curve at index 100 with 18% YoY expansion is a growing market; a tall seasonal spike with negative YoY is a market in retreat. We track YoY growth on a unit basis and on an ASP (average selling price) basis separately — the two diverge when the category premiumizes. According to IDC's Worldwide Quarterly Smart Home Device Tracker, smart projector ASPs have risen roughly 11% year-over-year through the most recent reported quarter, even as unit growth has moderated, which suggests buyers are trading up rather than buying more units. That dual-axis reading is what makes the model chart genuinely useful for OEM capacity planning, instead of just a marketing slide.

Building a 12-Month this projector Workbook for OEM Buyers
A reliable monthly sales trend line workbook is not a screenshot — it is a structured file with one row per model per channel, refreshed every Friday. We build ours in a shared Google Sheet that the DataMax OEM team updates from three feeds: factory shipments out of Shenzhen and Wuxi, U.S. retail sell-out from CTA-reported scanner data, and EU sell-through from the GfK panel that several distributor partners subscribe to. The SKU built this way carries real SKU granularity, so when a buyer asks us why their 1080p portable unit underperformed in October, we can answer with channel-level data instead of category averages.
the model rows should always carry at least eight columns: month, model SKU, channel, units shipped, units sold-through, ASP, days-of-cover, and a YoY flag. Days-of-cover is the inventory health metric that converts the unit into a procurement signal — sell-through below 14 days means reorder now, above 60 days means the model is at risk of becoming old stock that will distort the next cycle's reading. We flag any SKU whose days-of-cover stays above 75 for two consecutive months because that data point, if left in the dataset, drags down this projector curve and masks faster-moving premium models.
the projector data sources we trust
Most model data is most useful when broken down by channel, region, and price tier, not as a single line graph. The headline curve flattens important volatility. For example, a 1080p portable at $199 behaves on a different seasonality curve than a 4K ultra-short throw at $1,499, and a B2B the unit line for a hospitality integrator cycles almost opposite to a consumer Amazon storefront. When we chart OEM order intake at our Shenzhen factory, this projector for laser phosphor display models above 3000 ANSI lumens shows a tighter, taller peak in Q3, while entry-level LED units show a flatter, broader peak in Q4.
the unit refresh cadence
The typical sales trend line chart normalizes to a base index of 100, where 100 represents the trailing 12-month monthly average. The same chart usually includes a second line for year-over-year growth rate, which is the number procurement teams actually use. A month at index 130 with 12% YoY growth is healthier than index 145 with a 4% YoY decline. Smart projector OEM factories operating in Shenzhen track this YoY layer daily, because it controls raw LCD panel allocation and DMD chip orders from Texas Instruments.
| Source | Refresh | Lag | Coverage | OEM Use |
|---|---|---|---|---|
| Factory BoL export | Real-time | 0-3 days | Our SKUs only | Production gating |
| Retailer sell-out feeds | Weekly | 2-5 days | Our SKUs only | Days-of-cover alert |
| CTA U.S. shipment | Quarterly | 8-12 weeks | Total category | Capacity baseline |
| IDC smart home tracker | Quarterly | 10-14 weeks | Global category | Long-range forecast |
| GfK EU panel | Monthly | 4-6 weeks | EU retail sell-out | Regional split |

the model anomalies and how to read them
One model baseline indexing starts with selecting the right reference window. Most analysts use a trailing 12-month average, but for a category in fast refresh cycles, a trailing 6-month average smooths older model noise. We use a hybrid approach at DataMax: 12-month average for category-level the unit reporting, and 6-month rolling for model-level forecasting when a new SKU has been shipping less than nine months. This avoids the trap of a chart that "always points up" because old, slow-selling SKUs are dropping out.
One consumer technology association publishes quarterly U.S. projector unit shipment data through its industry reporting program, and a similar dataset is available from Statista's projector segment, both of which we cross-reference monthly. According to CTA-tracked sell-through figures, projector unit volumes in the U.S. show roughly 22% higher October-December volume versus the April-June trough, a pattern consistent across the last four reported years. This projector derived from that data shows January at index 78, March at index 92, June at index 105, September at index 118, and December at index 142, with November as the calendar peak.
the projector reading for premium SKUs versus value SKUs
the SKU reads differently at different price tiers. Premium 4K laser models (MSRP above $1,500) follow a flatter curve with a softer peak — these buyers are enthusiast-driven and less promo-sensitive, so their sales cycle compresses into a tighter November-December window. Value LCD models (MSRP below $400) follow the steepest curve because Black Friday pricing pulls in entry-level shoppers who would not otherwise buy. For OEM capacity planning, the implication is that the same sales trend line chart requires two different production plans: a steady baseline build for premium SKUs and a peak-loaded build for value SKUs. We have run both plans on the same factory line and confirmed that the premium baseline typically runs at 78% line utilization, while the value peak loads to 102% utilization for the September-November window.
the unit red flags for OEM contracts
Every sku numbers translate into procurement actions through a fixed offset, not a 1:1 mirror. For a 10-12 week production lead time plus 3-4 weeks of ocean freight, total supply chain lag runs 13-16 weeks. A retail peak in November requires component cut-in by mid-July and a factory PO confirmed by late June. We document this lag in every DataMax sales cycle briefing, because retail buyers frequently attempt to order against the model chart without back-calculating the offset, then miss their peak by four to eight weeks of critical lead time.
What to look for in a SKU report before you sign an OEM contract
In B2B sourcing contexts, evaluating OEM orders, the practical the unit workflow looks like this: identify the target retail month, subtract the lead time, subtract a 2-week buffer for tooling or firmware lock, then issue the component PO on that date. A buyer aiming at a January 2025 retail launch would have needed to confirm a DataMax OEM contract no later than August 2024. Procurement teams that fail to apply this offset rely on this projector curve that tells them when customers will buy, but not when they must order.
The single most overlooked column is sell-through velocity, which matters more than sell-in volume. Sell-in counts units shipped to a retailer's warehouse; sell-through counts units that actually left the shelf. A distributor can show a strong the unit using sell-in numbers while channels quietly accumulate 60-day inventory. We add a sell-through column sourced from partner retailer feeds, then flag any week where the gap exceeds 12 percentage points — that is our cue to slow the next PO.
Procurement checklist for OEM orders tied to a this projector
Most sku yoy growth is the line that tells you whether the curve is lifting or merely cycling. A flat curve at index 100 with 18% YoY expansion is a growing market; a tall seasonal spike with negative YoY is a market in retreat. We track YoY growth on a unit basis and on an ASP (average selling price) basis separately — the two diverge when the category premiumizes. According to IDC's Worldwide Quarterly Smart Home Device Tracker, smart projector ASPs have risen roughly 11% year-over-year through the most recent reported quarter, even as unit growth has moderated, which suggests buyers are trading up rather than buying more units. That dual-axis reading is what makes the model chart genuinely useful for OEM capacity planning, instead of just a marketing slide.
- Lead time of 35-45 days for the first pilot run, extending to 50-65 days during the September-November peak
- MOQ starting at 500 units per SKU, negotiable down to 200 for repeat buyers with 12-month histories
- Sample policy of 3 evaluation units shipped within 7 business days of PO confirmation
- Payment terms of 30% deposit, 70% against B/L copy for orders above $50,000
- Safety stock buffer of 18% above forecasted projector monthly sales trend volume for the peak window
- Quarterly business review cadence tied to the seasonality index recalibration
If a vendor cannot answer each of these six bullets with a number rather than a promise, the projector monthly sales trend curve they showed you is not yet binding on their operations — and you should treat the offer as a quote, not a commitment.
Frequently Asked Questions
What does a typical projector monthly sales trend curve look like for laser and LCD models?
One reliable the projector workbook is not a screenshot — it is a structured file with one row per model per channel, refreshed every Friday. We build ours in a shared Google Sheet that the DataMax OEM team updates from three feeds: factory shipments out of Shenzhen and Wuxi, U.S. retail sell-out from CTA-reported scanner data, and EU sell-through from the GfK panel that several distributor partners subscribe to. The SKU built this way carries real SKU granularity, so when a buyer asks us why their 1080p portable unit underperformed in October, we can answer with channel-level data instead of category averages.
How many months of history do we need before a projector monthly sales trend forecast is reliable?
A model rows should always c carry at least eight columns: month, model SKU, channel, units shipped, units sold-through, ASP, days-of-cover, and a YoY flag. Days-of-cover is the inventory health metric that converts the unit into a procurement signal — sell-through below 14 days means reorder now, above 60 days means the model is at risk of becoming old stock that will distort the next cycle's reading. We flag any SKU whose days-of-cover stays above 75 for two consecutive months because that data point, if left in the dataset, drags down this projector curve and masks faster-moving premium models.
Can a single retailer's flash promotion distort a projector monthly sales trend?
Yes. A single retailer flash promotion is the most common cause of a phantom projector monthly sales trend spike. We strip Prime Day, Black Friday, and Singles Day spikes before calculating OEM orders because those events reflect channel incentives, not category-wide seasonal demand. The NPD Group US retail tracking service publishes seasonally adjusted category sell-through specifically to remove this distortion.
What is the best lead time to lock before the projector monthly sales trend peak?
Most sku data quality depends entirely on the source. Retailer-direct sell-out feeds (Costco, Best Buy, Amazon Vendor Central) are the cleanest, but they cover only your own SKUs. Category-level feeds from CTA, Statista, and IDC fill the gap for competitive models, with a 4-6 week publication lag. For OEM orders specifically, we layer in our own factory bill-of-lading export numbers because those reflect actual wholesale pull, not announced forecasts. The model stitched from all three layers produces the cleanest read on seasonal demand for OEM capacity planning.
Do B2B and B2C buyers read the same projector monthly sales trend differently?
Yes. B2B procurement teams weight regional sell-through and days-of-cover first, then look at seasonality index. B2C shoppers mostly feel the curve through retailer promotional timing. DataMax publishes both lenses in the same workbook because OEM orders and consumer demand share the same projector monthly sales trend underlying signal.
Final takeaway for projector monthly sales trend planning
this projector files go stale fast. Retail sell-out refreshes weekly; category shipment data refreshes monthly with a one-month lag; our factory data is real-time. We schedule a Friday afternoon refresh in which the prior week's retail numbers drop into the sheet, the monthly category numbers update on the first business day of each month, and a quarterly audit compares the workbook totals against IDC's published totals with a tolerance band of plus or minus 5%. That discipline is what turns the projector chart from a presentation graphic into a procurement instrument.
| Source | Refresh | Lag | Coverage | OEM Use |
|---|---|---|---|---|
| Factory BoL export | Real-time | 0-3 days | Our SKUs only | Production gating |
| Retailer sell-out feeds | Weekly | 2-5 days | Our SKUs only | Days-of-cover alert |
| CTA U.S. shipment | Quarterly | 8-12 weeks | Total category | Capacity baseline |
| IDC smart home tracker | Quarterly | 10-14 weeks | Global category | Long-range forecast |
| GfK EU panel | Monthly | 4-6 weeks | EU retail sell-out | Regional split |
