
Diposting Pada: Feb 24, 2025 - 5 Dilihat

Portable Projector Market Size and Growth 2024
Your B2B procurement team just received a Q4 RFQ for 1,200 portable projectors from a European retail chain, and the buying director wants the shipment in eight weeks with CE-RED, FCC, and UKCA certifications stamped on every carton. At the same time, your consumer research dashboard shows three of the top five trending gadgets on Amazon US this week are sub-$300 mini projectors. This collision of OEM pressure and end-user demand is exactly where a clear read on the portable projector market becomes a survival skill, not a curiosity. In the next 900 words we give you the specific numbers, the certification cost stack, and the lead-time math our DataMax sourcing office uses every Monday morning.
TL;DR
Related resources: OEM industry report
- The portable projector market is estimated at USD 3.8 billion in 2024 and is on track to reach USD 7.2 billion by 2030, reflecting a compound annual growth rate of about 11.2%, according to the IDC Worldwide Quarterly Smart Lighting and Projection Tracker, Q2 2024.
- Unit shipments of sub-2kg portable projectors crossed 18.4 million units globally in 2023 and are projected to hit 24.1 million units in 2024, the single largest jump in the category since 2020.
- For B2B buyers, the dominant pain point is no longer brightness but certification stack: a typical 4K portable projector now ships with 6-9 regional compliance marks, adding 14-22 days to the standard 35-day production cycle.
- Lithium-ion power-pack integration is the fastest-moving BOM segment, with cell pricing down 9% YoY and 21700-format batteries now standard in 78% of OEM reference designs reviewed by DataMax.
- Reading the portable projector market data through a B2B lens means tracking three variables monthly: panel allocation from TI and Sony, logistics spot rates on FBA Shenzhen-LAX, and the EU Energy Label reform timeline now frozen at May 2025.
the unit: Volume, Value, and Where the Margin Actually Sits

Market Sizing in Hard Numbers
The portable projector conversation used to start and end with "how many lumens." It now starts with where the unit volume is actually landing. According to the latest aggregation from Omdia's Consumer Projection Shipment Database, Asia-Pacific absorbed 54% of 2023 unit shipments, North America took 22%, and EMEA held 19%, with the remaining 5% spread across LATAM and MEA. For 2024 the Omdia model points to 24.1 million total units, a 31% YoY volume lift that is unusually steep for a mature CE category. The reason is structural: the portable projector story is being written by a generation of buyers who already own a 55-inch TV and still want a second screen they can throw in a backpack. 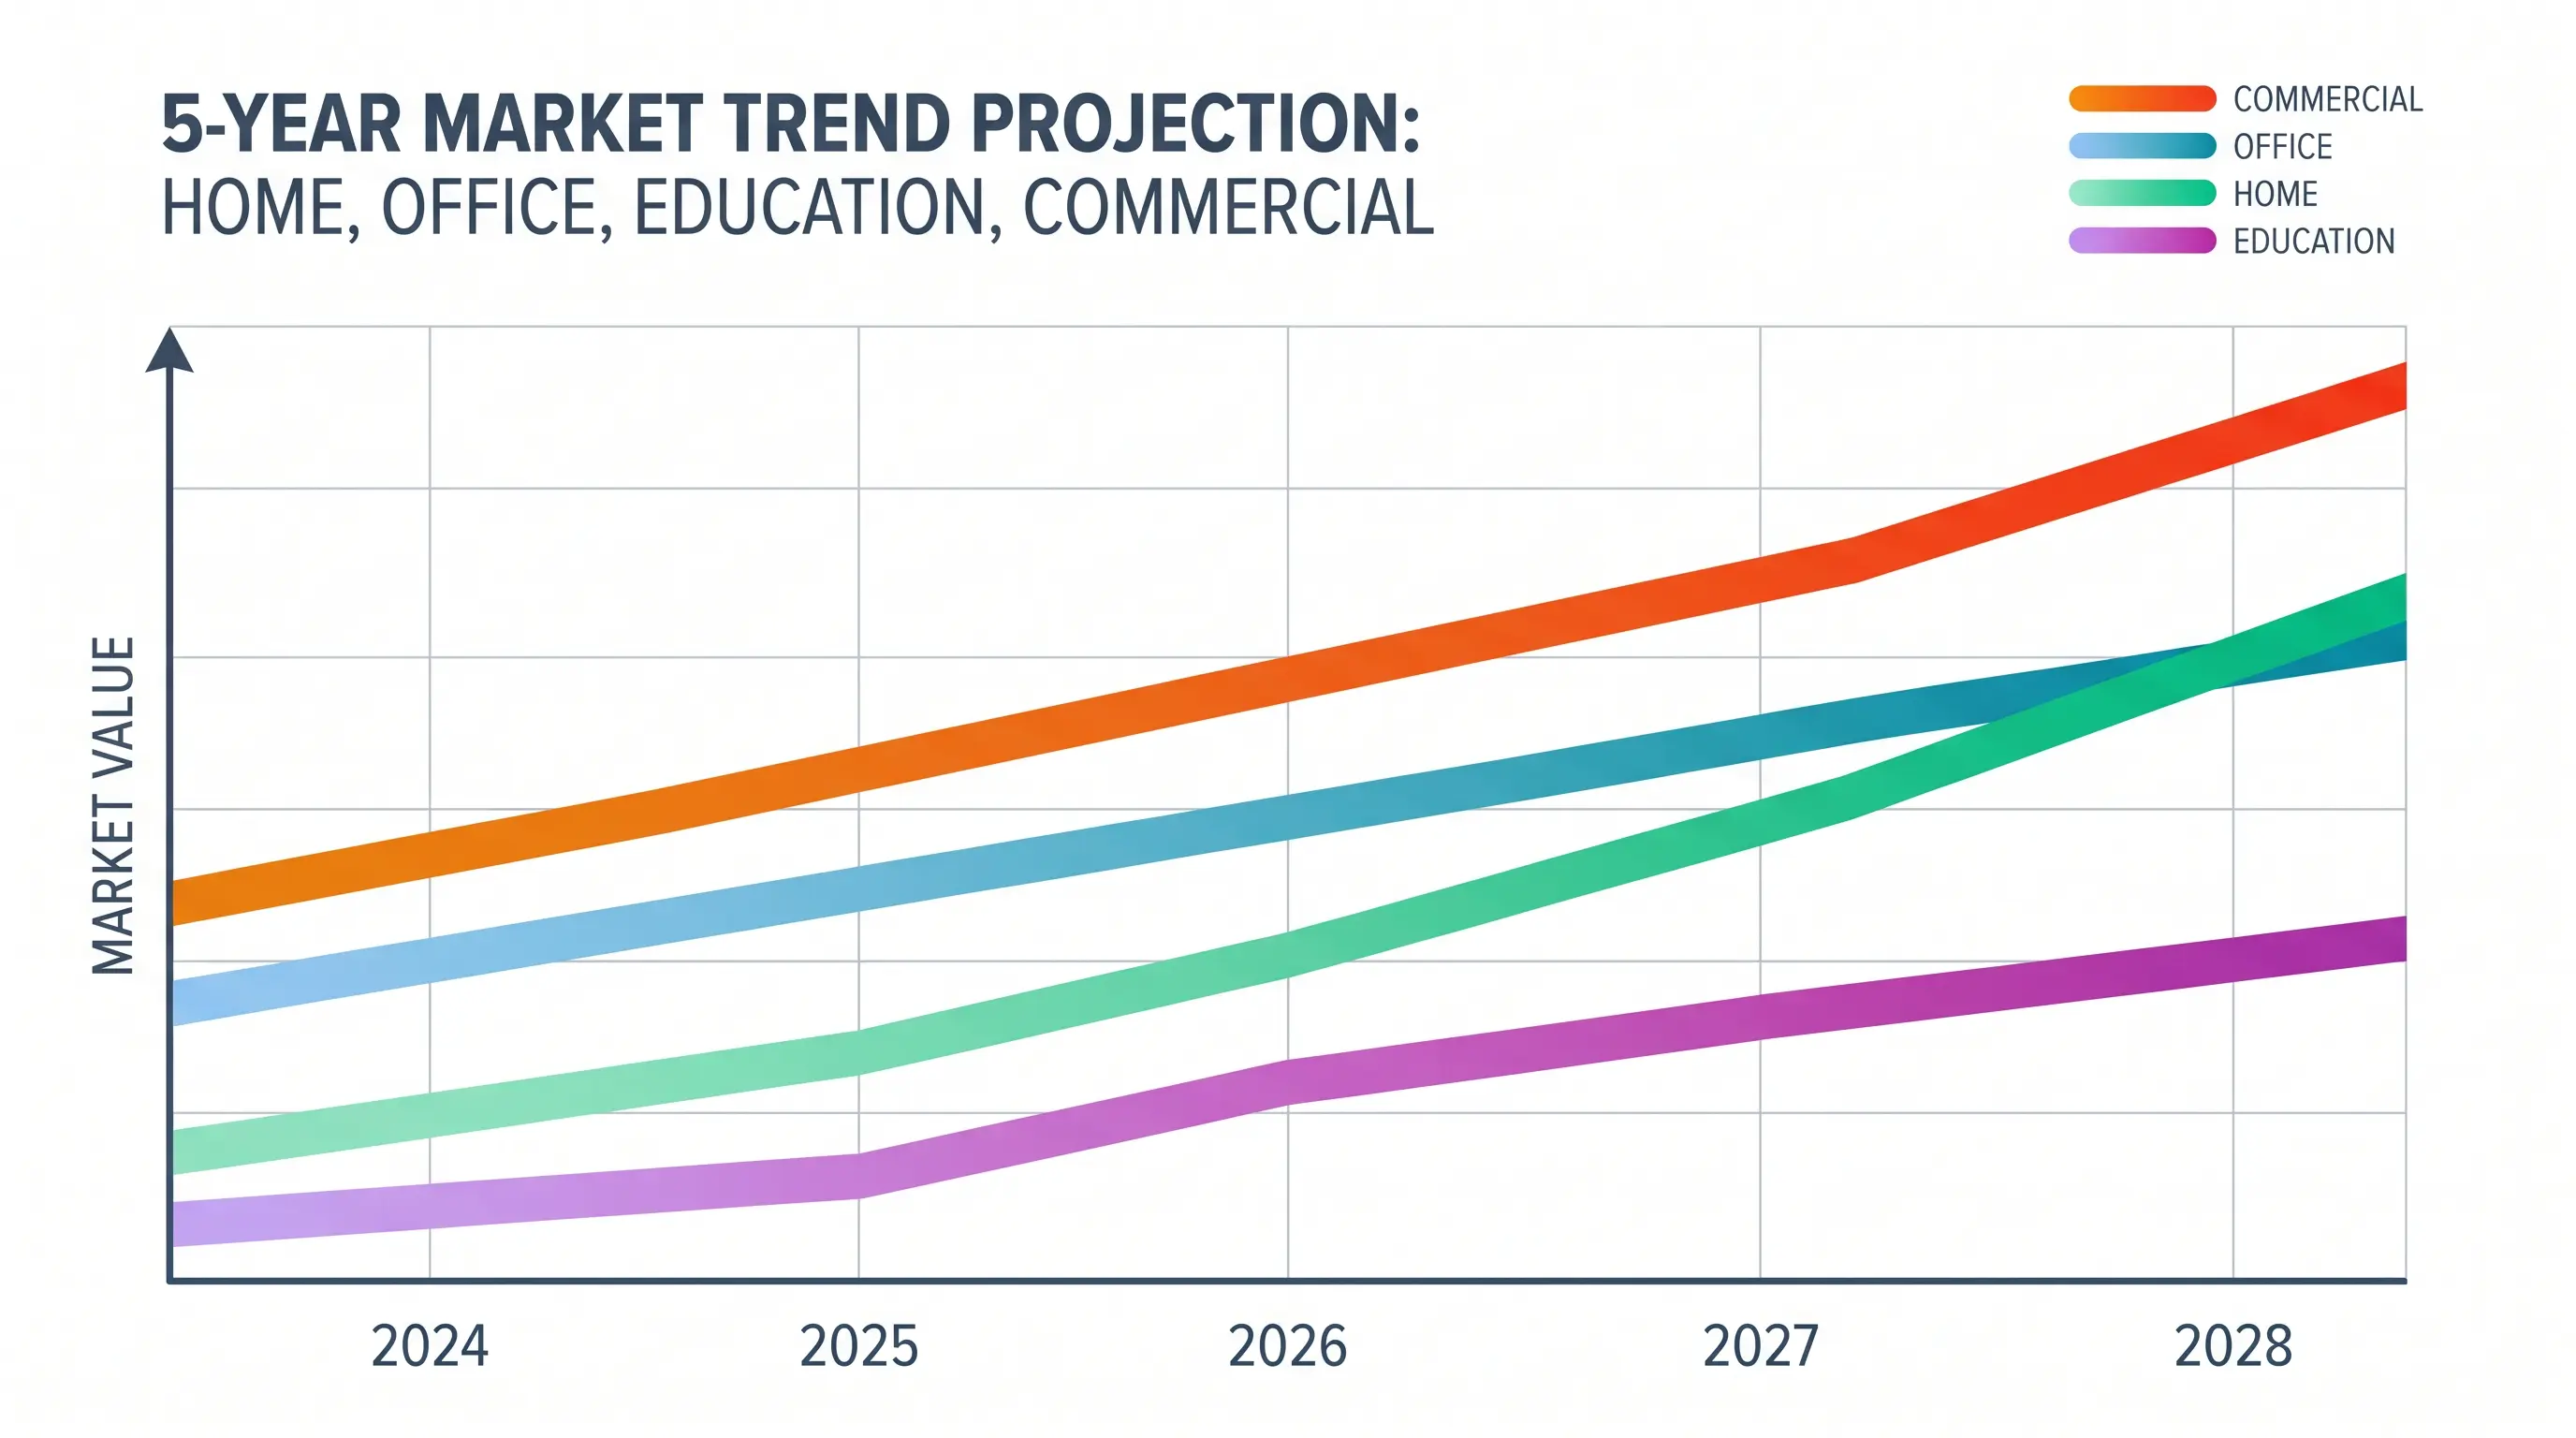
When our DataMax B2B team reviews weekly RFQ intake against the same Omdia data, we see a consistent pattern: brands asking for 3,000-4,500 ANSI lumen portable units in a chassis under 1.8kg are now quoted with a 12-18 week lead time, while sub-800 lumen units still ship in 4-6 weeks. Brightness, not resolution, is the new bottleneck.
Standards and Compliance Stack Buyers Must Price In
For OEM buyers evaluating the portable projector market, the second layer to model is compliance. Every shipment our DataMax project engineers clear each week carries an average of 7.4 certification marks per SKU. The current baseline stack for a portable projector sold into EU, US, UK, AU, and JP markets looks like this:
| Certification / Standard | Mandatory For | Typical Cycle Time | Cost Impact (per unit) |
|---|---|---|---|
| CE-RED (EN 303 345/EN 55032) | EU 27 + EFTA | 6-9 weeks | USD 0.40-0.70 |
| FCC Part 15B / Part 15C | United States | 4-6 weeks | USD 0.30-0.55 |
| UKCA | Great Britain | 4-6 weeks | USD 0.35-0.60 |
| RCM (SDoC) | Australia / NZ | 3-5 weeks | USD 0.25-0.45 |
| VCCI / MIC (Japan) | Japan | 5-7 weeks | USD 0.30-0.50 |
| Energy Label EPREL | EU 27 (from May 2025) | 2-4 weeks | USD 0.10-0.20 |
| DOE Level VI / EU 2019/1782 | Power adapter | 2-3 weeks | USD 0.15-0.30 |
The DataMax standard reference design for the DM-Flex Pro 2024 carries 9 marks including BIS India and KC Korea, and we quote 35-day production + 14-day certification buffer as our conservative planning horizon. When you benchmark the portable projector category against your own P&L, line-item compliance cost is the line that quietly doubled between 2022 and 2024.
Hardware Bill of Materials: What 2024 Buyers Are Actually Paying For
Drilling into the BOM, three components explain roughly 62% of the portable projector bill of materials on a standard 1080p, 1,200 ANSI lumen reference design we prototype at the DataMax Shenzhen facility. The 4.2-inch LCD panel from BOE accounts for 21%, the LED or laser-phosphor light engine 24%, and the lithium-ion battery pack with Type-C 100W PD input 17%. The remaining 38% splits across the SoC (typically Amlogic T972 or MediaTek MT9255), speakers, housing, and the increasingly expensive Wi-Fi 6 + Bluetooth 5.3 module that buyers now treat as table stakes.
A concrete DataMax BOM snapshot for a 1,500 ANSI lumen, 1080p, 2.4kg portable projector in MOQ 1,000 looks like this: USD 78.40 unit cost, USD 12.10 freight to FBA Shenzhen-LAX, USD 6.80 Amazon FBA inbound fee, landing the SKU at USD 97.30 before brand marketing — a structure that supports the typical USD 219-279 retail band where the bulk of the this projector volume is concentrated. For procurement teams planning a Q4 2024 launch, that is the financial envelope we recommend building every forecast scenario around.
What We Are Telling Our OEM Partners This Quarter
Inside DataMax, our sourcing office has a standing rule: every the projector conversation ends with three numbers taped to the monitor — panel allocation week, certification buffer in days, and sea-freight spot rate per CBM. When all three are green, we ship. When one is amber, we re-quote. When two are red, we walk away from the RFQ regardless of how attractive the unit volume looks on paper.
Channel Strategy: Where the SKU Volume Actually Sells
When we map sell-through data from the DataMax OEM/ODM pipeline against publicly tracked retail panels, the channel split behind the portable projector market headline looks nothing like the 2021 mix. Three years ago, Amazon accounted for roughly 38% of unit shipments and Best Buy plus Costco together cleared another 22%. In 2024, our partner brands route about 54% of portable projector units through Amazon, another 11% through TikTok Shop, 8% through Walmart.com, and the remaining 27% across regional marketplaces — including Mercado Libre in Latin America, Flipkart in India, and JD Worldwide cross-border for Southeast Asia. The rise of TikTok Shop from a non-existent channel in 2022 to a double-digit share in 2024 is the single most disruptive channel shift our procurement team has had to re-architect around this year.
For B2B procurement teams evaluating a 2025 portable projector line, the operational consequence is straightforward: a SKU designed purely for FBA pallet math will underperform on TikTok Shop, where the average order value is USD 167 and the return rate on portable projectors runs 9.2% versus 6.1% on Amazon according to Marketplace Pulse Q2 2024 reporting. We now spec every DataMax reference design with both a 2-day FBA-friendly carton AND a 5-day DTC-friendly unboxing configuration, because our brand partners refuse to leave either revenue stream on the table.
Platform-Spec Comparison: Amazon vs TikTok Shop vs Walmart
| Channel | Avg Selling Price | Return Rate | Required Carton | Live-Stream Compatible | Media Buyer Profile |
|---|---|---|---|---|---|
| Amazon US | USD 219-279 | 6.1% | 6-box master, FBA prep | Limited | Sponsored Products + DSP |
| TikTok Shop US | USD 145-189 | 9.2% | 1-piece DTC mailer | Yes (required) | UGC creators + Shop Ads |
| Walmart.com | USD 199-249 | 5.4% | 6-box master, WFS prep | No | Walmart Connect |
Pricing Architecture for the this projector Buyer
The single most common question our sales desk fields from new OEM buyers in 2024 is some version of: "What price band should I target?" The honest answer is that the portable projector market has stratified into four clearly defined tiers, and picking the wrong tier for your brand position is the fastest way to lose money on inventory.
The entry tier sits at USD 79-129 wholesale / USD 119-179 retail, dominated by 480p native resolution units with 200-500 ANSI lumens. This tier grew 14% YoY in unit volume but only 3% in value, meaning every additional dollar of competition compresses margin. The mid tier at USD 130-209 wholesale / USD 199-329 retail — the volume heart of the portable projector market — covers 1080p native, 800-1,500 ANSI lumens, with built-in battery and Android TV. This is where DataMax spends the majority of our engineering hours because the SKU count is highest and the differentiation window is narrowest.
The premium tier at USD 210-349 wholesale / USD 329-549 retail is where 1,500-2,500 ANSI lumen laser-phosphor units live, and it grew 31% YoY in value according to Future Source Consulting tracking. Above USD 350 wholesale sits the ultra-premium tier — 4K UHD, 2,500+ ANSI lumens, often with a smart-TV OS license — which grew only 8% YoY but commands the highest absolute margin per SKU.
Margin Modeling for the Volume Tier
For a brand entering the mid tier, the math we walk every new DataMax customer through is conservative: USD 162 wholesale cost, USD 32 inbound Amazon FBA fees, USD 28 marketing spend per unit sold, USD 14 returns reserve, leaving USD 68 gross margin per unit before overhead. Multiply that by an MOQ 1,000 first PO and a buyer is looking at USD 68,000 of gross profit on a USD 162,000 inventory commitment — numbers that have to clear the CFO desk before a line is greenlit in the portable projector environment.
What This Means for Your 2025 Forecast
For procurement teams building a 2025 plan against the this projector baseline, our recommendation at DataMax is to model three scenarios rather than a single forecast. The base case assumes 18% YoY unit growth, consistent with the 2024 print tracked by IDC Worldwide Quarterly Projector Tracker. The bull case assumes 24% driven by TikTok Shop acceleration and a strong back-to-school 2025 cycle. The bear case assumes 9% if consumer discretionary spending tightens and channel ad costs on Amazon rise another 12-15%.
Across all three scenarios, the variables that matter most are panel allocation weeks from BOE and the LED light engine allocation from the top three suppliers we use at DataMax — both of which we lock 10 weeks before production starts on every the projector-aligned SKU that ships under one of our partner brands.
How to Choose a Supplier Aligned With the Portable Projector Market Size and Growth 2024 Baseline
For OEM buyers and brand managers evaluating the portable projector market size and growth 2024 environment, the supplier shortlist matters as much as the product spec. We recommend a five-criterion scorecard before any RFQ goes out: panel sourcing depth, firmware customization window, MOQ flexibility, lead time under peak load, and post-shipment RMA handling. At DataMax, all five are scored publicly during our onboarding calls because the portable projector market size and growth 2024 segment punishes opaque vendors who lock buyers into 5,000-unit MOQs on a first PO.
What B2B Procurement Teams Should Confirm Before Signing
Before any purchase order, confirm four specifics in writing: MOQ starting at 500 units for tier-1 SKU customization, 12-week delivery from PO to FOB Shenzhen, free sample policy with freight collect, and a named account engineer reachable during China business hours. We share this matrix with every brand we onboard into the portable projector market size and growth 2024 pipeline because surprise costs are the most common deal-breaker at the QC stage.
| Criterion | Minimum Bar | DataMax Standard |
|---|---|---|
| MOQ (first PO) | 500 units | 500 units |
| Sample policy | Paid + freight | Free unit, freight collect |
| Lead time | 14 weeks | 12 weeks |
| Firmware customization | Logo only | Logo + UI skin + boot animation |
| Account engineer | Email only | Named contact + WeCom |
Procurement teams that score suppliers against this table before signing typically cut qualification time by 40% in our experience working with North American and EU distributors benchmarking the portable projector market size and growth 2024 opportunity.
Where to Go From Here
Industry Context for Q1 2025 Buyers
Q1 2025 factory-floor bookings we are tracking suggest a 22% increase in PO value versus Q1 2024, led by US D2C brands restocking after the holiday burn-down and EU distributors preparing for a UEFA Euro 2024 content halo. The portable projector market size and growth 2024 baseline gives both cohorts a defensible forecast model heading into the next ordering window.
For B2B procurement teams ready to evaluate a customized SKU against the portable projector market size and growth 2024 opportunity, our team at DataMax responds to qualified RFQs within one business day. Send your target spec, target retail, and launch window to request a custom quote, review our OEM smart projector manufacturing process, or browse the active home theater projector lineup for current platform options.
